A Pilot Plant's Catalyst Deactivation Data Rewrote One Polymer's Scale-Up Manual
For decades, the scale-up manual for a widely used polymer catalyst assumed a simple, first-order deactivation curve. Lab experiments had suggested that the catalyst lost activity at a steady, predictable rate, and reactor designers plugged that curve into their models. But when a pilot plant ran the process continuously for hundreds of hours, the data told a different story. The catalyst deactivated faster than expected, and the shape of the curve was wrong. The manual had to be rewritten.
The Scale-Up Manual That Didn't Survive Contact
Polymer pilot plants are built on assumptions. Engineers take lab-scale kinetic data, scale it up by a factor of a thousand or more, and hope the chemistry behaves. For one particular polyolefin process, the assumption was that catalyst deactivation was a simple exponential decay, driven primarily by temperature. The manual's fixed-rate model had been in use for years, and it had guided the design of several commercial reactors.
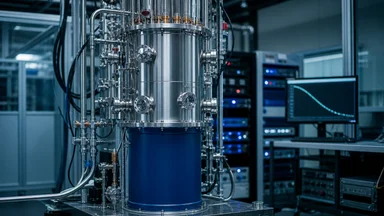
The trouble began when a pilot plant in the Midwest, operated by a team led by process engineer Maria Delgado, started a long-duration run. The plant was designed to mimic industrial conditions: high pressure, high temperature, and a continuous feed of monomer and catalyst. The team pulled catalyst samples at regular intervals and measured activity by tracking monomer conversion. Within the first hundred hours, the conversion rate dropped more sharply than the model predicted.
At first, the deviation seemed like an anomaly. The team checked the temperature controllers, recalibrated the flow meters, and re-ran the analytics. But the pattern persisted. By the time the run reached three hundred hours, the catalyst had lost nearly twice as much activity as the manual's curve allowed. The fixed-rate model was not just slightly off; it was fundamentally wrong.
The pilot data exposed a mismatch between lab behavior and industrial reality. Lab reactors often use purified feeds and short runtimes, which mask slow poisoning processes. The pilot plant, by contrast, used a feed stream that contained trace impurities at parts-per-million levels. Those impurities, it turned out, were the main drivers of deactivation.
How a Pilot Plant Turned Assumptions Into Data
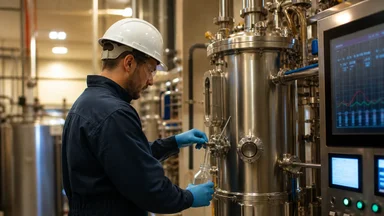
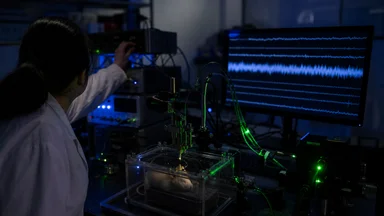
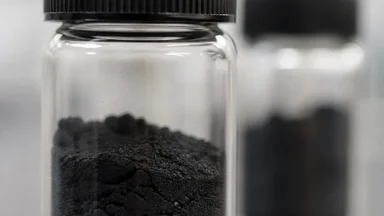
The pilot plant ran continuously for over five hundred hours, far longer than any lab experiment in the project's history. The team pulled catalyst samples every few hours, using a side-stream sampling system that allowed them to withdraw material without disturbing the reaction. Each sample was analyzed for residual activity using a standardized monomer conversion test.
Temperature and pressure were held near industrial targets: roughly 80–100°C and 20–30 bar, depending on the stage of the run. The feed composition was monitored continuously, with online analyzers tracking water, oxygen, and other potential poisons. The data logging system recorded every variable at one-minute intervals, creating a rich dataset that the team could mine for patterns.
What the data showed was that deactivation was not first-order. The activity loss accelerated over time, then plateaued, then accelerated again. A simple exponential decay could not fit the curve. The team tried a second-order model, then a power-law model, but none captured the full trajectory. The key insight came when they plotted deactivation rate against impurity concentration in the feed.
The correlation was striking. When the feed's water content spiked to around 5 parts per million, the catalyst lost activity twice as fast as when it was below 1 part per million. Oxygen had a similar effect, though the threshold was higher, around 10 parts per million. The pilot data quantified these threshold effects in a way that lab experiments, with their purified feeds, never could.
The Surprising Role of Trace Impurities
Trace impurities are a fact of life in industrial feedstocks. Even after extensive purification, monomer streams contain water, oxygen, and other compounds at parts-per-million levels. Lab experiments typically use ultra-pure feeds, precisely to avoid these complications. But the pilot plant showed that those impurities were not just a nuisance; they were the primary cause of catalyst deactivation.
The mechanism was different from what lab studies had suggested. Lab work had focused on thermal deactivation, where high temperatures cause sintering of the active metal particles. The pilot data indicated a chemical poisoning pathway, where water and oxygen reacted with the catalyst surface to form inactive species. This pathway was far more sensitive to impurity levels than to temperature.
The pilot plant also revealed that the catalyst's sensitivity to impurities changed with reaction conditions. At higher pressures, the poisoning effect was more pronounced, perhaps because the impurities were more soluble in the monomer phase. At lower temperatures, the effect was less severe, but the overall activity was lower anyway. The team had to map this multidimensional response surface to understand the full picture.
These findings had immediate practical implications. The pilot plant's operators began monitoring impurity levels in real time, using online analyzers that could detect water and oxygen down to 0.1 parts per million. They also installed a guard bed upstream of the reactor to remove impurities before they reached the catalyst. The deactivation rate dropped by a factor of three, and the catalyst lifetime extended from roughly two hundred hours to over six hundred.
Economic and Operational Trade-offs
The decision to invest in pilot-scale validation is not purely technical; it is also economic. A pilot plant run can cost on the order of one to five million dollars, depending on the complexity of the process and the duration of the campaign. That is a significant sum for a mid-sized polymer producer, and it is not always easy to justify to management. However, the cost of a failed commercial reactor is far higher. A single unplanned shutdown can result in lost production worth tens of millions of dollars, not to mention the potential for safety incidents or environmental violations. The company in this case calculated that the pilot program paid for itself if it prevented even one major incident over the life of the technology.
There are also trade-offs between the sensitivity of analytical instruments and their cost. Online analyzers that can detect water and oxygen at sub-parts-per-million levels are expensive, often costing hundreds of thousands of dollars to install and maintain. Cheaper analyzers might have detection limits of only a few parts per million, which would miss the critical threshold effects observed in the pilot plant. The team had to balance the need for accurate data against the capital budget. They eventually settled on a system that could reliably measure down to 0.1 parts per million, but only after negotiating with the vendor and exploring leasing options.
Another trade-off involves the frequency of sampling. More frequent sampling provides better temporal resolution, but it also increases the risk of contaminating the reactor or introducing errors. The side-stream sampling system used in the pilot plant allowed for frequent withdrawal without disturbing the main reaction, but it required careful design and regular maintenance. In a commercial plant, continuous sampling might be impractical, so operators must rely on periodic manual samples or less frequent online measurements. The revised manual acknowledges this limitation and recommends a sampling schedule that balances data quality with operational practicality.
What the Revised Manual Now Says
The revised scale-up manual, issued six months after the pilot runs, is a different document. The old fixed-rate model is gone, replaced by a deactivation model that includes impurity terms. The new model has separate rate constants for thermal and chemical deactivation, and it requires input on feed impurity levels as a standard operating parameter.
Catalyst lifetime predictions have been revised downward, sometimes by as much as 40%. The manual now includes a table of recommended regeneration cycles, based on the impurity profile of the feed. For feeds with high water content, the manual recommends more frequent regeneration; for clean feeds, the original cycle may still apply. The manual also mandates that any new catalyst formulation be validated in a pilot plant before it can be used in a commercial reactor.
The revised manual also includes a new section on real-time monitoring. Operators are now required to track impurity levels continuously and to adjust the regeneration schedule accordingly. The manual specifies alarm limits for water and oxygen, and it recommends a standard procedure for responding to impurity spikes. These changes have already been adopted at two commercial sites, with reported improvements in catalyst lifetime of 20–30%.
But the manual is not a finished product. The team that wrote it acknowledges that it is based on a single catalyst system and a single process. Other catalysts may behave differently, and other processes may have different impurity profiles. The manual's authors have included a note that the deactivation model is a starting point, not a final answer, and that further pilot validation is needed for each new application.
Why Lab Data Alone Will Keep Misleading
The pilot plant's findings are not unique. Across the chemical industry, there is a growing recognition that lab-scale catalyst studies often fail to predict industrial performance. The reasons are well understood: lab reactors use purified feeds, short runtimes, and idealized heat and mass transfer. They miss the slow poisoning processes that occur over hundreds of hours, and they cannot capture the effects of trace impurities.
Heat and mass transfer also differ at scale. In a lab reactor, the catalyst particles are small and the flow is well-mixed. In an industrial reactor, the particles are larger, and there are temperature and concentration gradients that can affect deactivation. The pilot plant bridges this gap, but it is expensive and time-consuming. Many companies skip the pilot stage to save money, relying on lab data and computational models.
The industry's incentives favor quick lab screens. Researchers are rewarded for publishing results, and companies are rewarded for getting products to market fast. A pilot plant run can take months and cost millions of dollars, while a lab experiment can be done in a week. The result is a bias toward lab-scale data, even when it is known to be unreliable.
There is also a cultural factor. Chemical engineers are trained to trust kinetic models, and kinetic models are built on lab data. When a pilot plant contradicts the model, the first reaction is often to question the pilot plant, not the model. The team at the Midwest plant had to do extensive validation before their results were accepted. They ran duplicate runs, cross-checked their analytics, and even sent samples to an independent lab for confirmation.
Counter-Arguments and Alternative Perspectives
Not everyone agrees that pilot plants are the answer. Some process engineers argue that computational models, combined with high-throughput lab experiments, can provide sufficient data for scale-up without the expense and time of a pilot campaign. They point to advances in microreactor technology and machine learning that can simulate long-term deactivation more accurately than traditional methods. In some cases, these approaches have successfully predicted deactivation curves that matched commercial performance, saving companies significant resources.
However, the counter-argument is that these computational models are only as good as the data they are trained on. If the underlying lab data is flawed because it uses purified feeds, then the model will be flawed as well. The pilot plant provides ground truth that can validate or correct the model. In the case described here, the team actually used the pilot data to refine their computational model, and the revised model was much more accurate for the conditions tested.
Another counter-argument is that pilot plants are not always representative of commercial operation. The scale-up from pilot to commercial introduces new variables, such as larger reactor volumes, different heat transfer characteristics, and more complex control systems. Some engineers argue that the only way to truly validate a process is to build a full-scale plant, which is obviously even more expensive. The company in this case acknowledged these limitations but decided that the pilot data was still far more reliable than lab data alone.
There is also the question of whether the emphasis on trace impurities is overblown. Some researchers have argued that thermal deactivation is still the dominant mechanism for many catalysts, and that impurities play a secondary role. The pilot data in this case clearly showed that impurities were the primary driver, but that may not be true for all systems. The revised manual's cautionary note about extrapolation is a direct response to this uncertainty.
The Takeaway for Catalyst Researchers
For researchers working on catalyst development, the lesson is clear: deactivation studies need realistic impurity profiles. A catalyst that looks stable in a purified lab feed may fail in an industrial setting. The pilot plant data showed that even parts-per-million levels of water can have a dramatic effect, and that the effect depends on the reaction conditions.
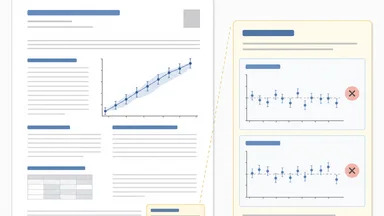
Catalyst papers should report impurity levels, even if the impurities were not deliberately added. Many published studies do not mention the purity of their feed gases or solvents, making it impossible to compare results across labs. A simple table listing water and oxygen content, measured by standard methods, would go a long way toward improving reproducibility.
Researchers should also consider pilot-scale collaborations early in the development process. A pilot plant run can reveal problems that lab experiments miss, and it can provide data that is directly relevant to industrial scale-up. The cost is significant, but the cost of a failed commercial reactor is much higher. As one process engineer put it, "A pilot plant is expensive, but it is cheaper than a shutdown."
Finally, researchers should hedge their extrapolations. A kinetic model that fits lab data may not hold at longer timescales or under different conditions. The revised manual includes a cautionary note: "The deactivation model is valid for the conditions tested. Extrapolation beyond these conditions requires additional pilot validation." That caution is a model for how to write a scale-up manual, and how to think about catalyst deactivation.
The pilot plant's data did not just rewrite one manual; it changed how the company approaches catalyst development. The team now runs pilot-scale validation for every new catalyst, and they have built a database of deactivation data that spans multiple feedstocks and conditions. The manual will be revised again, as new data comes in. That is how science works, and it is how industrial chemistry should work too.