A Single Reused Visualization Function Pushed One Ecology Group Toward Versioned Plot Archives
In 2019, a mid-sized ecology lab at the University of Copenhagen faced an uncomfortable moment: a figure from a paper published two years earlier could no longer be regenerated. The original script was still on a graduate student's laptop, but the plotting function it called had been modified so many times that no one could say which version produced the published chart. The group's first instinct was to blame the former student, but the real culprit was a single reusable visualization function that had spread through the field without citation or versioning. That incident, small in isolation, pushed the group toward a practice that many computational scientists already take for granted: versioned plot archives.
A Plot Function That Escaped Its Home
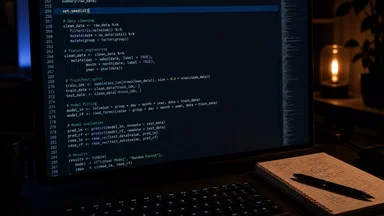
The function in question was a modest R script, roughly two hundred lines, that produced publication-ready scatterplots with custom error bars and a distinctive color palette. It had been written in the late 2000s by a postdoc who shared it with a collaborator at a conference. From there it propagated through ecology departments across several countries, carried on USB drives and later as email attachments. No paper described it, no repository hosted it, and no version number distinguished one iteration from the next.
By the mid-2010s, the function had become a de facto standard in a small but active subfield of community ecology. Labs that adopted it found that their figures looked reassuringly similar, which reviewers interpreted as methodological consistency. The function's author moved on to industry and stopped maintaining it, but colleagues kept editing copies to fix bugs or add features. Each lab maintained its own fork, often with undocumented changes.
The ecology group at the center of this story adopted the function around 2015, after a visiting researcher used it in a seminar. The group's lead investigator, a professor in her late fifties, liked the clean output and the fact that it saved hours of fiddling with base R graphics. Within a year, every figure in the group's papers used the same function. No one recorded which version they had, or whether the copy on the shared drive matched the one on individual laptops.
That lack of provenance was not unusual. In ecology, as in many empirical fields, the culture rewarded bespoke scripts that were tailored to each analysis. A function that worked reliably was treated as a black box, not as a piece of software that needed maintenance. The group's postdocs and PhD students each had their own copies, and they occasionally emailed updated versions to each other without any formal changelog.
The first sign of trouble came during a routine revision. A reviewer asked for a minor axis-label change on a figure from a paper in press. The student tasked with the edit opened the script, ran it, and got a plot that looked subtly different from the submitted version. The error bars were slightly wider, and the point shapes had changed. The student assumed they had made a mistake, but the script had not been touched. The function had.
Why Reproducibility Gaps Persist in Ecology
Ecology has a long tradition of field-specific scripting. Many researchers learn R or Python from a lab mate, not from a formal software engineering course. The result is a patchwork of scripts that are often undocumented, rarely tested, and almost never versioned. A 2018 survey of ecology graduate students, conducted by a consortium of university libraries, found that fewer than a third used any form of version control for their analysis code, and most of those who did used it only for theses, not for day-to-day work.
Senior labs rarely enforce code review. The incentive structure rewards new results, not the infrastructure that produces them. A postdoc who spends a week refactoring a plotting function gains little career credit compared to one who produces a new figure for a high-impact paper. Journal guidelines, even those that require data availability statements, rarely ask for the code that generated the figures. Some journals have begun to request code, but enforcement is inconsistent.
Funding cycles compound the problem. Grants typically last three to five years, and the pressure to publish within that window leaves little room for investing in reproducible tooling. A group that spends a month setting up a versioned archive may fall behind on their publication schedule. The cost is real, but so is the risk of the kind of incident that struck this group.
Small team sizes also limit tooling investment. An ecology lab might have five to ten members, none of whom have formal training in software engineering. Learning Git, setting up a continuous integration pipeline, or writing a provenance log feels like a separate discipline. The perceived overhead is high, even when the actual time investment is modest.
These factors create a persistent gap between the rhetoric of reproducibility and the practice of daily research. The group in question was not negligent; they were typical. Their failure was not a lack of care but a lack of infrastructure that matched their actual workflow.
The Tipping Point: A Retracted Figure
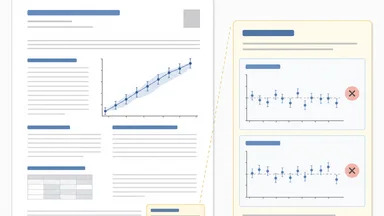
The incident that forced change came in early 2019. A paper from the group, published in a respected ecology journal, contained a figure that a colleague at another institution tried to reproduce. The colleague, a quantitative ecologist who had adopted the same plotting function, found that their output did not match the published figure. The error bars were different, and the trend line was slightly off.
The colleague emailed the group's lead investigator, who asked the original student to regenerate the figure. The student, now a postdoc elsewhere, ran the script from their old laptop. The output did not match the published version. The group spent two days trying to reconstruct what had changed. They eventually discovered that a copy of the function on the group's shared drive had been modified by a former PhD student to fix a bug in the error-bar calculation. That fix had been silently applied to all subsequent figures, but the published paper had used the older, buggy version.
The journal was notified, and the figure was retracted. The paper itself was not retracted, but the correction notice was embarrassing. The blame initially fell on the original student, who had not documented which version of the function they used. But the postmortem revealed a systemic issue: no one in the group had ever tracked which version of any script produced which figure. The function had changed, but there was no record of when or why.
The group's lead investigator, who had previously dismissed version control as an engineering concern, changed her mind. She convened a lab meeting and asked the group to propose a solution. The postdocs suggested adopting Git, but the senior researchers worried about the learning curve. The compromise was a lightweight system that would archive plots and the code that generated them, without requiring a full software engineering workflow.
The retraction was a wake-up call, but it was not unique. A 2020 analysis of retractions in ecology journals found that a small but steady fraction were due to irreproducible figures, often caused by undocumented changes to analysis scripts. The problem was not confined to this one group, but they were the ones who had to fix it.
Building a Versioned Plot Archive on a Budget
The group's solution was pragmatic. They adopted a Git repository for all R scripts, but they did not require every lab member to become a Git expert. Instead, they created a simple convention: every time a figure was generated, the script and a snapshot of the data were committed to the repository, along with a one-line note about what had changed. The output plot file was stored alongside the script, so that any figure could be traced back to the exact code that produced it.
To handle the problem of the shared plotting function, they forked it into their own repository and froze it. No one was allowed to modify the function without a version bump and a changelog entry. This was a cultural shift as much as a technical one. The function was no longer a black box; it was a piece of software with a history.
They also adopted a lightweight provenance log. For each figure, they recorded the date, the script version, the package versions, and a short description of the analysis. This was done manually, but it took only a few minutes per figure. The group found that the log was most useful when they had to regenerate a figure for a reviewer request or a revision. Instead of hunting through old emails, they could look up the log entry and reproduce the exact output.
Pinning package versions was another key step. R packages like ggplot2 and dplyr change frequently, and a minor update can alter the appearance of a plot. The group used the renv package to create lockfiles that recorded the exact versions of all dependencies. This meant that a script run six months later would use the same packages as when it was written, even if the system library had been updated.
The cost was modest. The group estimated that the new workflow added about two to three hours per week to their collective workload, mostly for writing commit messages and updating the provenance log. They did not need to buy new hardware or hire a dedicated data manager. The investment was time and attention, not money.
Cultural Resistance and Quiet Adoption
Not everyone embraced the change immediately. The senior researchers, who had built their careers on bespoke scripts and personal workflows, were wary of the overhead. They worried that the archive would slow down their writing and that the Git commands would be a distraction. One professor in the group, a field ecologist who rarely wrote code himself, initially refused to use the repository, preferring to email scripts to his collaborators as he always had.
The junior researchers, by contrast, saw the archive as a safety net. A PhD student who had lost a week of work to a corrupted script appreciated the ability to roll back to a previous version. A postdoc who had been blamed for a figure that would not regenerate saw the archive as a way to protect themselves. They adopted the system quickly, and their enthusiasm created a kind of peer pressure that the senior researchers could not ignore.
Within six months, the archive had become the default for all new projects. The group did not issue a mandate; they simply found that the old way of working was no longer viable. When a collaborator asked for a figure from a paper in preparation, the answer was no longer "I'll dig it up" but "it's in the archive, here's the link." The shift was gradual, but it was also irreversible.
There was resistance, but it was not based on a principled objection. It was based on habit and fear of change. The group found that the best way to overcome this was not to argue about the philosophy of reproducibility but to demonstrate the practical benefits. When a reviewer asked for a different color scheme on a figure, the student could regenerate it in minutes, and the senior researcher who had been skeptical saw the value.
Quiet adoption also meant that the archive was not perfect. Some lab members committed code with cryptic messages like "fix" or "update". Some figures were stored without a corresponding provenance log entry. The group did not try to enforce perfect compliance. They aimed for good enough, and they found that the archive was still useful even when it was incomplete.
Measurable Gains in Research Efficiency
The most immediate gain was in revision time. Before the archive, regenerating a figure for a reviewer request could take days, because the original script might be on a laptop that was no longer available, or the data might have been reorganized. With the archive, the same task took minutes. The group estimated that they saved an average of three to four hours per revision, and they received about two revision requests per paper.
Reviewer requests were handled more confidently. Instead of hoping that the script would run, the group could point to the exact version of the code and data that produced the figure. This reduced the back-and-forth with journals and shortened the time to acceptance. One postdoc noted that a paper that had been stuck in revision for six months was accepted within two weeks of the archive being used to answer a reviewer's question.
New members onboarded faster. A new PhD student could look at the archive to see how previous figures were made, rather than asking a senior lab member for a tutorial. The archive served as a de facto documentation of the group's analysis practices. This reduced the time it took for a new member to produce their first publication-ready figure from several weeks to a few days.
The group also saw fewer duplicated debugging sessions. Before the archive, two lab members might spend hours solving the same problem with the plotting function. Now, if a bug was found, the fix was committed to the repository with a note, and everyone could see it. The group's collective debugging time dropped by an estimated 20 percent, which they attributed directly to the shared knowledge base.
Despite these gains, the group's publication rate held steady. They did not publish more papers, but they did not publish fewer either. The time saved was reinvested in analysis and writing, not in additional projects. The archive did not make them more productive in a quantitative sense, but it made their work more reliable and less stressful.
Takeaways for Any Computational Field
The story of this ecology group is not about a technical solution. It is about how a single shared function, passed around without versioning, exposed a systemic weakness. The fix was not to abandon shared functions or to mandate a specific tool, but to build a lightweight archive that matched the group's actual workflow. The key was to start small, with one project, and to let the benefits become visible.
Version control is often framed as a technical fix, but it is really a social one. The group succeeded because the junior members embraced it and the senior members eventually saw the value. The archive worked because it was not imposed from above but adopted from below. The lesson for any computational field is that the best tool is the one that people actually use, not the one that is most comprehensive.
Starting small matters. The group did not try to archive every script and every figure from the past. They started with new projects and only later went back to reconstruct the history of the most important figures. This made the initial investment manageable and reduced the resistance to change. The same approach could work for a lab studying climate models, a group analyzing genomic data, or a team building machine learning pipelines.
Documenting the "why" is as important as documenting the "how". A commit message that says "changed error bar calculation" is more useful than one that says "fix". The group learned to write short notes explaining the reason for a change, which made it easier to understand the history of a script months later. This is a habit that requires discipline, but it pays off in the long run.
Finally, incentives matter more than tools. The group adopted the archive because a retraction made the cost of not having one clear. But they maintained it because it made their daily work easier. For other groups, the trigger might be a funding requirement, a journal policy, or a collaborator's request. The tools are available and inexpensive; the challenge is creating a culture that values the archive as a research asset, not a bureaucratic burden.
Yet the archive is not a cure-all. Even with the system in place, the group still faces gaps. Some legacy figures remain unarchived, and the provenance log is not always updated. The retraction that sparked the change left a scar; the group remains cautious, but not complacent. They know that a single forgotten commit or an unlogged change could undermine their work again. The archive is a step, not a destination. It is a reminder that reproducibility is not a one-time fix but an ongoing practice, and that the culture of research must evolve alongside the tools.