COPD Exacerbations Spike When Patient Portals Hide the Spirometry Trend Lines
When Maria, a 68-year-old retired teacher in Lisbon, logs into her patient portal, she sees a list of lab results and a few spirometry readings. What she does not see is the slow, steady downward slope of her FEV1 values over the past two years. That slope, had she been able to see it, might have prompted her to call her pulmonologist earlier, adjust her inhaler use, and perhaps avoid the emergency room visit that landed her in the hospital for three days last winter.
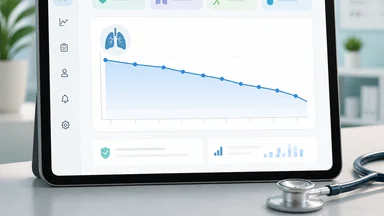
Maria's story is not unique. Across high-income health systems, patient portals have become a standard channel for patients to access their own health data. Yet the way that data is presented often obscures the most clinically meaningful information. For respiratory conditions like chronic obstructive pulmonary disease (COPD), the key metric is not a single FEV1 reading but the trajectory of that reading over time. A single value is a snapshot; a trend line is a movie. Portals frequently show the snapshot but omit the movie.
The Hidden Trend Line: When Data Withholding Becomes a Clinical Act
Patient portals promise transparency, but the reality is often selective. Lab results, such as blood counts or cholesterol levels, are typically displayed as discrete values with reference ranges. Spirometry, however, is treated differently. Patients may see a table of numbers, often without reference ranges or context. They may see "FEV1: 1.8 L" and have no idea whether that is good, bad, or stable. The trend line, which could show a gradual decline from 2.2 to 1.8 over eighteen months, is rarely displayed. Some portals do not include spirometry at all, leaving patients to rely on written notes from clinic visits that may or may not mention numbers.
The omission is rarely malicious. It often reflects the priorities of the software designers and the health systems that purchase their products. Lab results are easy to display because they are discrete and standardized. Spirometry trends require graphing capabilities, which are more complex to implement and may not be a priority for vendors. But the effect is the same: patients are left without the information they need to understand their own disease trajectory.
This is not a trivial issue. COPD is a progressive disease, and the rate of decline varies widely between individuals. Knowing whether your lung function is declining slowly or rapidly is crucial for treatment decisions. When patients cannot see the trend, they cannot advocate for themselves or make informed choices about when to seek care.
Consider the case of James, a 72-year-old former factory worker in Manchester. His portal shows a list of FEV1 readings from the past three years, but no graph. He remembers that his breathing has felt tighter lately, but he cannot tell if his lung function is actually declining. When he mentions this to his nurse, she pulls up the trend on her screen and shows him a clear downward slope. James is shocked; he had no idea. That single conversation changes his approach to his daily inhaler use and prompts him to attend a pulmonary rehabilitation program. But how many patients never have that conversation?
The Biology of COPD Exacerbations: Why Early Warning Matters
COPD exacerbations, the acute worsening of symptoms that often require hospitalization, do not come out of nowhere. They are typically preceded by a gradual decline in lung function over weeks. This decline is detectable in spirometry readings before symptoms become noticeable. Inflammatory processes in the airways ramp up, and FEV1 drops incrementally.
This pre-exacerbation window is a critical opportunity for intervention. If a patient or clinician notices a downward trend, they can increase bronchodilator use, start a course of oral corticosteroids, or adjust other medications to blunt the severity of the upcoming exacerbation. Studies have shown that early intervention can reduce the need for emergency care and hospitalization.
However, when trend data is hidden, this window closes. Patients may not notice the gradual decline because they feel fine until the exacerbation hits. Clinicians, who may only see patients every few months, might miss the trend if they are only looking at single readings. The result is that exacerbations are treated after they become severe, rather than prevented or mitigated earlier.
This is not hypothetical. A 2023 study in the European Respiratory Journal found that patients who had access to home spirometry trends were more likely to adjust their medication in response to early declines and had fewer exacerbations than those who did not. The trend line itself was the intervention.
Another study from the Netherlands, published in 2022, followed a cohort of COPD patients using a home monitoring system that displayed daily FEV1 trends. The researchers found that patients who saw a declining trend were more likely to contact their care team before an exacerbation became severe, leading to a reduction in hospital admissions by roughly a third compared to a control group that did not have access to the trend display. While the study was small, it adds to the growing evidence that visual trend feedback empowers patients to act early.
Portal Design Flaws: Usability, Interface, and Data Presentation
The design of patient portals is a major barrier to trend transparency. Many portals are built primarily for clinicians, with patient views as an afterthought. The patient-facing interface often shows a list of recent results without any graphical representation. Graphing tools, when they exist, are often buried in menus or require the patient to select multiple parameters and time ranges, which is not intuitive for many users.
In the United States, large electronic health record vendors like Epic and Cerner have made strides in recent years, but spirometry visualization remains inconsistent. Some health systems have implemented custom dashboards that show trend lines prominently, but these are the exception rather than the rule. The default is often a table of numbers that means little to a patient without clinical training.
Usability is also a concern. Older adults, who constitute the majority of COPD patients, may struggle with small fonts, complex navigation, and the need to create multiple logins. Even when data is available, the cognitive load of interpreting it without context can be overwhelming. Patients may see a number that looks low and panic, or they may see a number that looks normal and ignore a real decline.
These design choices reflect institutional priorities. Health systems invest in portals for administrative efficiency, appointment scheduling, and prescription refills, not necessarily for patient education or empowerment. Spirometry trends are a niche feature that may not be on the radar of the procurement committee.
There is also the issue of data fragmentation. A patient might have spirometry done at a primary care clinic, a specialist's office, and a hospital laboratory, each with its own portal or record system. Even if one portal shows a trend, it may only include data from that one site. The patient is left to mentally piece together a complete picture, which is nearly impossible. Interoperability standards exist, but their implementation is patchy. A unified trend view across all care settings would require a level of data integration that many health systems have not achieved.
Patient Self-Management: The Cognitive Load of Raw Numbers
Patients with COPD are expected to manage their condition daily: taking medications, monitoring symptoms, and making decisions about activity levels. This self-management is demanding, and the data they receive should reduce cognitive load, not increase it. Raw numbers without trends force patients to track their own history mentally, which is error-prone and stressful.
Trend lines, on the other hand, provide a clear visual summary of disease progression. They allow patients to see patterns, such as a seasonal dip in lung function or a response to a new medication. This visual feedback can motivate adherence and encourage earlier help-seeking. A patient who sees a steady decline is more likely to call their clinician than one who sees a single number that looks normal.
The cognitive burden of fragmented data is real. Patients may receive spirometry results from different clinics or devices, each with its own format and reference ranges. Without a unified trend view, they cannot compare values across time or settings. This fragmentation is a design failure that adds to the stress of living with a chronic disease.
Some patients have taken matters into their own hands, using spreadsheets or paper charts to plot their FEV1 readings. But this is an additional burden that not everyone can manage. The health system should provide the tools, not rely on patient ingenuity.
There is also an emotional dimension. Seeing a trend line can be confronting, but it can also be empowering. A patient who sees their lung function stabilize after quitting smoking or starting a new medication gains a sense of control. Conversely, a patient who sees a decline may feel anxiety, but that anxiety can be channeled into action if the clinician is prepared to discuss next steps. The alternative—ignorance—does not prevent anxiety; it simply delays it until the patient is in the emergency room.
Evidence from Real-World Systems: What Works and What Doesn't
There are examples of systems that get this right. In the United Kingdom, the NHS has been promoting the use of digital tools for asthma and COPD, and some apps allow patients to see trend graphs of their peak flow or FEV1. The NHS website for asthma includes a page where patients can track their symptoms and see a visual representation of their control over time.
In Japan, some health systems have integrated wearable spirometers that transmit data to a portal, where both patients and clinicians can view trends. These systems have been associated with earlier detection of exacerbations and fewer hospitalizations, though the evidence is mainly from small pilot studies.
In the United States, the picture is more mixed. Large academic medical centers may offer sophisticated patient portals, but community hospitals and private practices often lag behind. A 2024 survey by the COPD Foundation found that fewer than half of COPD patients had access to spirometry trends in their portal, and many did not even know such data existed.
Australia has experimented with telehealth programs that send automated alerts when a patient's home spirometry drops below a threshold. These alerts can prompt a call from a respiratory nurse, allowing for early intervention. The key is that the trend is not just displayed but acted upon by the care team.
One notable example comes from Sweden, where the national quality registry for COPD includes patient-reported outcomes and spirometry data. Some regions have integrated this registry with patient portals, allowing individuals to see their own trends alongside anonymized comparisons to other patients with similar characteristics. This approach has been praised for fostering a sense of partnership between patients and clinicians, though it requires robust data governance and patient consent.
However, not all digital interventions have succeeded. A 2021 randomized trial in the United States tested a portal enhancement that included spirometry trend graphs. The study found no significant reduction in hospitalizations, but the authors noted that the intervention was hampered by low patient engagement and technical glitches. This highlights that simply adding a graph is not enough; the tool must be usable and integrated into the care pathway.
Clinical Implications: How Hiding Trends Harms Care
The clinical consequences of hidden trend data are measurable. When patients cannot see their decline, they delay seeking care until symptoms are severe. This leads to more emergency department visits and higher hospitalization rates. Each exacerbation also accelerates the long-term decline in lung function, creating a vicious cycle.
Patient-clinician communication suffers as well. When a patient arrives at a clinic appointment, they may not have a clear picture of how their lung function has changed since the last visit. The clinician, if they do not pull up the trend graph, may miss a subtle but important decline. The conversation then focuses on acute symptoms rather than long-term management.
Guidelines from the Global Initiative for Chronic Obstructive Lung Disease (GOLD) recommend regular spirometry monitoring and trend-based assessment. Yet the tools to implement this in daily practice are often missing. A guideline is only as good as the data it is applied to.
Some clinicians argue that showing patients trend lines could cause anxiety or lead to over-treatment. But this underestimates patients' ability to understand their own disease. With proper context and education, most patients can use trend data to make better decisions, not worse ones.
There is also a cost argument. Hospitalizations for COPD exacerbations are expensive, both in human and financial terms. The average cost of a single COPD-related hospitalization in the United States is estimated to be between USD 10,000 and USD 20,000, depending on the severity and length of stay. If trend transparency can prevent even a small percentage of these admissions, the savings could be substantial. Health systems that invest in portal improvements might see a return on investment through reduced emergency care.
Practical Solutions: Advocating for Transparent Data in Portals
Patients can start by asking their clinicians for trend graphs. Many electronic health records have the capability to generate these, even if the patient portal does not display them. A simple request during a clinic visit can result in a printout or a screen share of the trend line.
Clinicians can also proactively share spirometry trends with patients, explaining what the slope means and how it relates to their symptoms. This can be part of a routine visit, taking only a few minutes but potentially improving adherence and early intervention.
Advocacy at the health system level is crucial. Patient advisory councils can request that portal vendors prioritize trend visualization. Health systems can make it a requirement in their procurement contracts. Policy makers can include data transparency standards in certification criteria for electronic health records.
Third-party apps, such as those that connect to Bluetooth spirometers, offer another pathway. These apps often include trend graphing as a core feature. Patients can use them to track their own data, even if their health system's portal is lacking. However, integrating this data back into the clinical record remains a challenge.
Finally, a broader cultural shift is needed. Health data belongs to the patient. Withholding it, even inadvertently, undermines autonomy and erodes trust. The trend line is not just a convenience; it is a fundamental right.
For patients who are not technically savvy, family members can be enlisted to help interpret data. Some health systems offer training sessions or printed guides. The goal is to make trend data accessible to all, regardless of age or digital literacy. Simple visualizations, such as a line graph with a clear "normal" range, can be understood by most people with minimal explanation.
Clinicians also need training on how to discuss trends with patients. A trend line can be alarming if presented without context. The clinician's role is to translate the data into actionable steps: adjust medications, schedule a follow-up, or consider pulmonary rehabilitation. This requires communication skills that are not always taught in medical school.
In the long term, artificial intelligence could play a role in predicting exacerbations from trend data. Machine learning algorithms can detect subtle patterns that humans might miss, and they could alert both patients and clinicians. However, these tools are still in development, and they must be validated in diverse populations before they are widely deployed.
This article is for informational purposes only and is not a substitute for professional medical advice. Always consult your healthcare provider about your specific condition.